
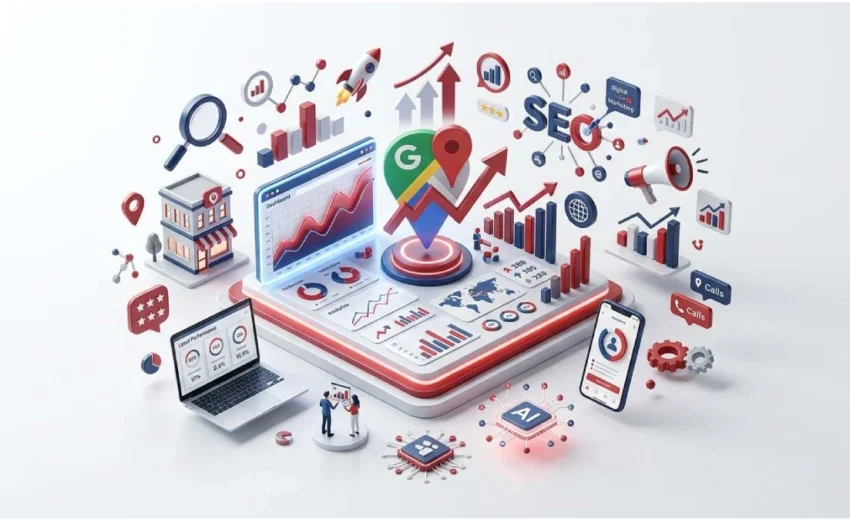
Google Business Profile Insights hold the answers.For local searches, Around 42% of users click a result in the Google Maps Pack. You check the Performance tab, see rising views and dropping calls, and have no clue what changed. Most guides just repeat definitions without explaining what to do.
That gap costs you real customers every week. Wrong categories, missing photos, and untagged links quietly bleed traffic while you keep guessing. Meanwhile, your competitors use the same data to steal your local visibility.
This guide fixes that with a clear breakdown of Google Business Profile Insights. You’ll learn what each metric counts, why numbers drop, how to compare with GA4, and which fix to try first. Everything is in plain English with real numbers and no filler
Key Points:
- Free reports show how customers find and interact with your business on Google Search and Maps.
- Five core metrics to track: views, interactions, calls, direction requests, and search queries.
- 86% of impressions come from discovery searches, not branded ones.
- Data lags 2 to 3 days, with only 6 months of history in the dashboard.
- Pair with GA4 and Search Console for full-funnel tracking.
- Tag your website link with lowercase UTM parameters to fix attribution.
What Are Google Business Profile Insights (and Why They Matter)
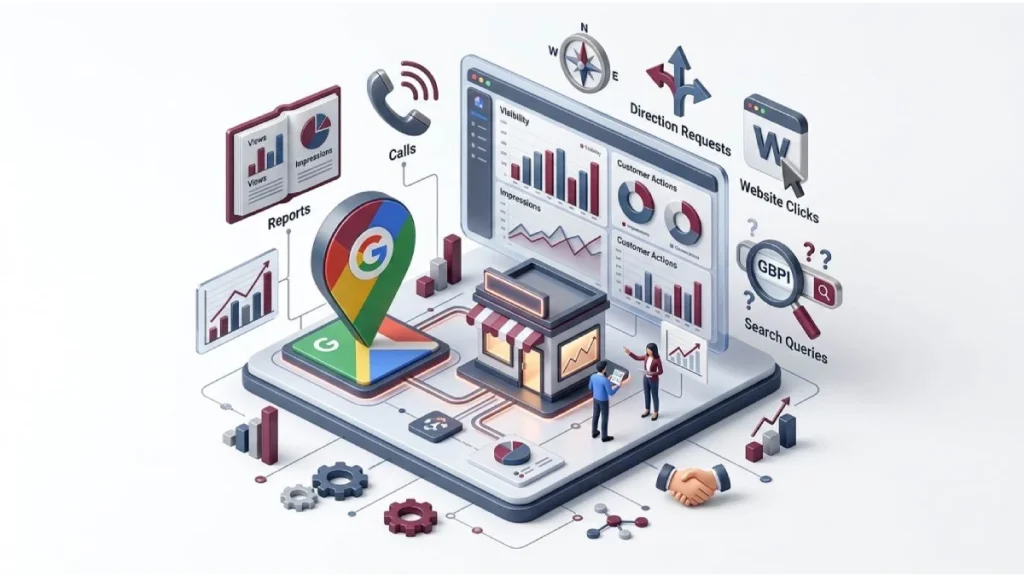
Google Business Profile Insights are free reports that show how customers find and interact with your business on Google Search and Google Maps. Google renamed the tool from “Insights” to “Performance” on February 20, 2023. It tracks real user actions like calls, direction requests, and website clicks.
Businesses in Google’s Local Pack receive 126% more traffic and 93% more customer actions. The average small business gets about 1,009 searches per month, including 781 discovery searches and 228 direct searches. A complete profile earns 7x more clicks than an incomplete one.
Where to Find Your GBP Insights
You can find your GBP Insights in the Performance tab through Google Search, the Google Maps app, or the Business Profile Manager. Google moved the reports out of the old dashboard on February 20, 2023. You now manage everything from search results or the mobile app.
Access depends on where you work. Desktop users start from Google Search. Owners on the go prefer the Maps app. Agencies with multiple stores, like retail chains or dental groups, use the Business Profile Manager.
From Google Search
Sign in to your Google account and search your exact business name. Your Business Profile panel will appear at the top of the results, with a “Performance” button that opens your reports. You can also type “my business” as a shortcut if you’re logged in as the owner or manager.
From the Google Maps App
Open the Google Maps app, tap your profile icon in the top-right corner, select “Your Business Profile,” then tap “See more” in the Performance section. The mobile view shows simpler summaries, but it’s handy for quick checks on calls and direction requests.
From the Business Profile Manager
Go to business.google.com and sign in to see all your listings. This dashboard is built for owners with multiple profiles, like restaurant chains, franchises, or agency clients. Check the box next to any location, click the “Actions” dropdown, and select “Insights” to open reports or download bulk CSV data.
What to Do If You Can’t See the Performance Tab
A missing Performance tab means a browser glitch, login mismatch, or pending verification. Try clearing your cache, switching browsers like Chrome to Edge, or opening an incognito window first. If nothing works, your profile may be suspended, which causes about 31% of sudden access issues and needs an appeal through Google’s official tool.
Key Metrics Explained in Plain English
GBP Insights tracks five metric groups: views, interactions, calls, direction requests, and search queries. Each one shows a different part of the customer journey. Together, they reveal how people find your business and what they do next.
Google uses specific rules for views, clicks, and impressions that often confuse new users. Below is a plain-English breakdown of what matters and what to ignore.
Views, Impressions, and Clicks
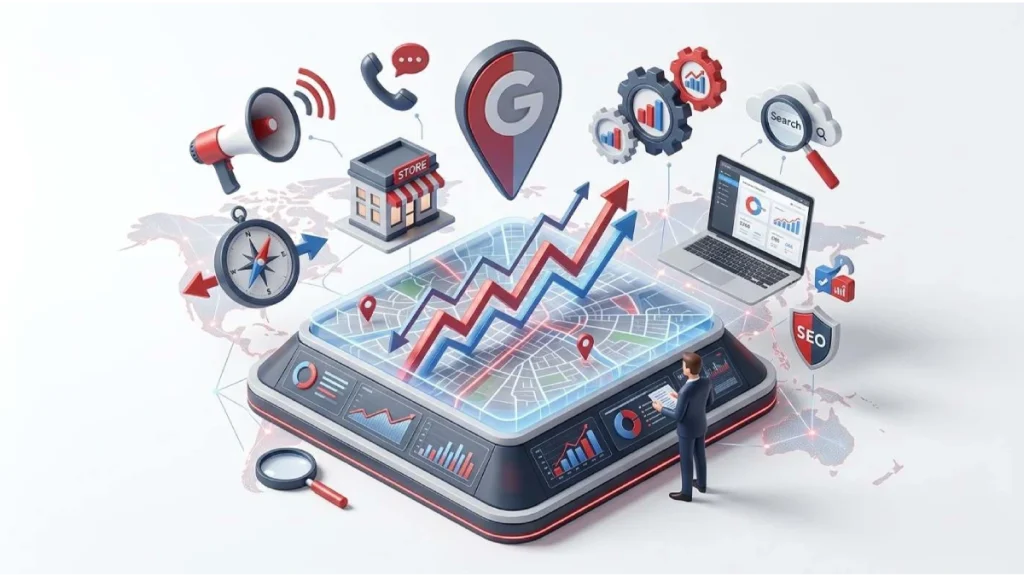
Views count unique daily visitors. Impressions count how often your profile appeared. Clicks count actions taken. Google tracks views across four buckets: Search Mobile, Search Desktop, Maps Mobile, and Maps Desktop. One person is counted once per bucket per day. Clicks matter more than views since they show real customer intent.
Calls, Directions, Website Clicks, Messages, and Bookings
These five actions are the core conversions inside your google business profile insights report. Calls track taps on your phone number. Directions log unique route requests from tools like Google Maps or Waze. Google retired the Call History log on July 31, 2024, so missed calls and timestamps are gone. Native messaging ended that day too, so message data now applies to WhatsApp or SMS integrations.
Photo and Post Performance
Google removed native photo view tracking and Google Post analytics on February 20, 2023. You can no longer see photo views or post clicks inside the dashboard. Photos still matter, since profiles with complete libraries get 42% more direction requests and 35% more website clicks. To track post performance, add UTM tags to your call-to-action buttons and watch clicks in Google Analytics.
The Search Queries Report
The Search Queries Report shows the exact terms people typed to find your profile. It updates monthly and keeps a rolling six-month history. Common examples include phrases like “24 hour pharmacy,” “italian restaurant,” or your brand name. Google hides queries with fewer than 15 impressions and groups them under “<15,” so the visible list is directional, not full.
How Customers Find You: Direct, Discovery, and Branded Searches
Google groups searches into three types: direct, discovery, and branded. Each shows a different kind of customer intent. Direct searches happen when someone types your exact business name, like “Blue Bottle Coffee.” Discovery searches use general terms, like “coffee shop near me” or “vegan bakery.” Branded searches include a related brand you carry, like “Invisalign provider” or “Nike store.”
About 86% of google business profile insights impressions come from discovery searches. Most new customers find you by what you sell, not who you are. Google removed the visual breakdown from the dashboard on February 20, 2023, but the data is still in the Performance API and tools like BrightLocal or Local Falcon. If your discovery numbers are low, your categories or description need work.
How to Read Trends, Drops, and Spikes
Reading trends means comparing time periods, spotting real drops, and knowing when data lag is fooling you. A single bad day means nothing. Real problems show up as steady shifts over weeks, not overnight swings.
Owners panic when views dip for a day or two. Most of the time, it’s noise from weather, local events, or Google’s daily testing. Focus on patterns, not single data points.
Comparing Month-Over-Month and Year-Over-Year
Year-over-year comparisons filter out seasonality. A landscaping business sees spring spikes and winter drops, so January-to-January shows real growth. Google’s dashboard stores 6 months of history, so download your google business profile insights as CSV files each month to build a long-term record.
Why Your Views or Calls Suddenly Dropped
Sudden drops come from suspensions, category changes, algorithm updates, or competitor flagging. Google suspensions cause about 31% of severe ranking drops. Fake competitor reports, like “permanently closed” flags, cause another 23%. Check your listing status through the Business Profile appeals tool, then review recent edits to categories, hours, or address fields.
Reporting Delays and Data Lag
Performance reports lag real time by 2 to 3 days, and up to 4 days through the API. Search Queries take about 5 days to fully populate. Ignore the last 4 to 5 days when reviewing trends to avoid false alarms.
What GBP Insights Won’t Tell You
Google Business Profile Insights won’t show you unique users, on-site behavior, exact rankings, or whether calls were answered. The reports stop at the click. Once a user leaves Google, tracking stops.
Here are the main blind spots:
- No on-site behavior tracking. GBP can’t tell if a click led to a form fill or sale. Pair it with GA4.
- No neighborhood-level rank grid. Impressions show visibility, not block-by-block rank. Use Local Falcon or BrightLocal.
- No call outcome data. The Calls metric tracks taps, not whether the call connected.
- No hidden search terms. Queries under 15 impressions stay grouped as “<15.”
- No ad and organic separation. A profile shown as both an ad and Map Pack result counts as two searches.
Google business profile insights is a pre-click tool. It shows how customers find and interact with your listing, but not what happens after. Combine it with GA4, Search Console, and rank-tracking tools for the full picture.
GBP Insights vs. Google Analytics vs. Search Console
GBP Insights tracks profile activity. Google Analytics tracks website behavior. Search Console tracks organic search visibility. Each tool covers a different stage of the customer journey. Numbers between them rarely match, since ad blockers stop GA4 tracking and Search Console counts clicks GA4 sometimes misses.
To fix attribution gaps, add UTM tags to your google business profile insights website link, like utm_source=google, utm_medium=organic, and utm_campaign=gbp_profile. Keep everything lowercase. Never add UTM tags to internal website links, as that breaks your traffic source data.
How to Turn GBP Insights Into Action
Turning GBP Insights into action means matching each weak metric to a specific fix. Data alone doesn’t grow your business. What matters is spotting patterns and adjusting the right settings.
Focus on one change at a time. If you edit your category, hours, and photos in the same week, you won’t know what worked. Test one change, wait two weeks, and check the shift in your google business profile insights.
Low Discovery Searches — Fix Categories and Description
Low discovery searches mean your categories or description don’t match what customers search for. Set one specific primary category, like “Vegan Bakery” instead of “Restaurant.” Correct categories boost local visibility by 17%. Write a description up to 750 characters, which earns 2.5x more impressions.
Few Calls or Directions — Check Hours, Photos, and Reviews
Few calls or direction requests mean your profile is visible but not building trust. Add fresh photos, like storefronts, interiors, and products, since photo-rich profiles earn 42% more direction requests. Keep holiday hours updated and reply to every review. Active profiles gain 2x more physical visits.
Weak Search Queries — Guide Your Posts and Content
Weak search queries mean Google isn’t matching your profile to the right customer language. Check your Search Queries Report for terms like “emergency plumber” or “same-day delivery.” Add them to your services, posts, and website copy. Use the language your customers use to shape your Google Posts, service pages, and product listings.
Reporting on GBP Insights for Clients or Multiple Locations
Reporting at scale means using bulk CSV exports, the Performance API, or dashboards like Looker Studio. Checking each profile by hand works for one store, not for chains, franchises, or agency clients. Small teams can download combined CSV data from business.google.com. Enterprise brands with 50+ locations pull raw data through the Business Profile Performance API.
For visual monthly reports, connect your google business profile insights to Looker Studio through third-party tools like Porter, Coupler.io, or Databloo, since Looker has no native GBP connector. Blend GBP data with GA4 and Google Ads to track calls, direction requests, and website clicks with conversions. This shows clients how local visibility drives real revenue.
Common Mistakes to Avoid
Most GBP tracking mistakes come from misreading data, not missing it. Small setup errors can distort your entire report. Here are the ones to watch for.
- Overreacting to short-term dips. Views swing with weather, events, or Google’s daily testing.
- Treating views as total traffic. Views count unique daily users per surface, not repeat visits.
- Relying on one platform. GBP, GA4, and Search Console show different parts of the journey.
- Skipping UTM tags. Untagged links lump GBP traffic into generic “organic” in GA4.
- Using uppercase UTMs. GBP and gbp split into two reports, breaking your data.
- Adding UTMs to internal links. This overrides your real traffic source.
- Reading only the Interactions summary. It hides drops in calls or bookings.
- Ignoring the Search vs. Maps split. Each surface needs a different strategy.
FAQs
Are Google Business Profile Insights free?
Yes, GBP Insights are free for all verified business owners. You need a Google account and a verified profile to access the Performance tab.
How long is Google Business Profile Insights data available?
The dashboard stores 6 months of data. The Performance API keeps for 18 months. Export CSV files monthly to build a longer record.
How often is the data updated?
Performance data updates every 2 to 3 days, and up to 4 days through the API. Search Queries update once a month and take about 5 days.
Why don’t my GBP numbers match Google Analytics?
GBP tracks profile activity. GA4 tracks website sessions after the click. Ad blockers and slow-loading pages stop GA4 scripts, creating gaps.
What is a discovery search in GBP Insights?
A discovery search happens when someone types a general term, like “coffee shop near me,” instead of your business name.
Will AI search replace Google Business Profile in the future?
No, AI tools like Google AI Overviews and Gemini still pull data from Business Profiles. A well-optimized profile shapes both classic and AI search results.
Conclusion
Google Business Profile Insights show how customers find and interact with your business across Google Search and Google Maps. The Performance report tracks views, calls, direction requests, website clicks, and search queries. It gives you a clear view of pre-click behavior.
Watch out for data lag, hidden queries, and view-counting rules that confuse new users. Pair the data with Google Analytics and Search Console for the full picture. Focus on one change at a time, and tag your website link with lowercase UTM parameters.
Open your Performance tab today, fix one weak metric, and track the change for the next month to see real growth.
17 August 2026
How to Use Google Search Console for Local...

17 August 2026